Context
In order to measure the effectiveness of a marketing campaign, customers need to be randomly split into two groups, target group with different treatment(marketing collaterals) and control group as a benchmark. We will use a R package pwr to conduct an analysis to answer following questions:
What is the minimum numbers of customers should be assigned to the control group so the reslut could be statiscally significant?
What we run a significance testing based on the campaign results?
library(pwr)Power Analysis
To do a power analysis for a binomial distribution (outcome like yes or no), suppose we know
- Total customers in target group = 10,000
- Expected response rate in target group = 5%
- Expected response rate in control group = 2.5% (from the historical campaign)
- Significance level = 0.05 (95% confidence)
- Power = 0.80 (the chance we dont make a false negative error)
Question: What is the minimum number of customers should be in control group to make the test statiscally significant?
p.out <- pwr.2p2n.test(h = ES.h(p1 = 0.05, p2 = 0.025)
              , n1=10000
              , n2=NULL
              , power = 0.8
              , sig.level = 0.05)


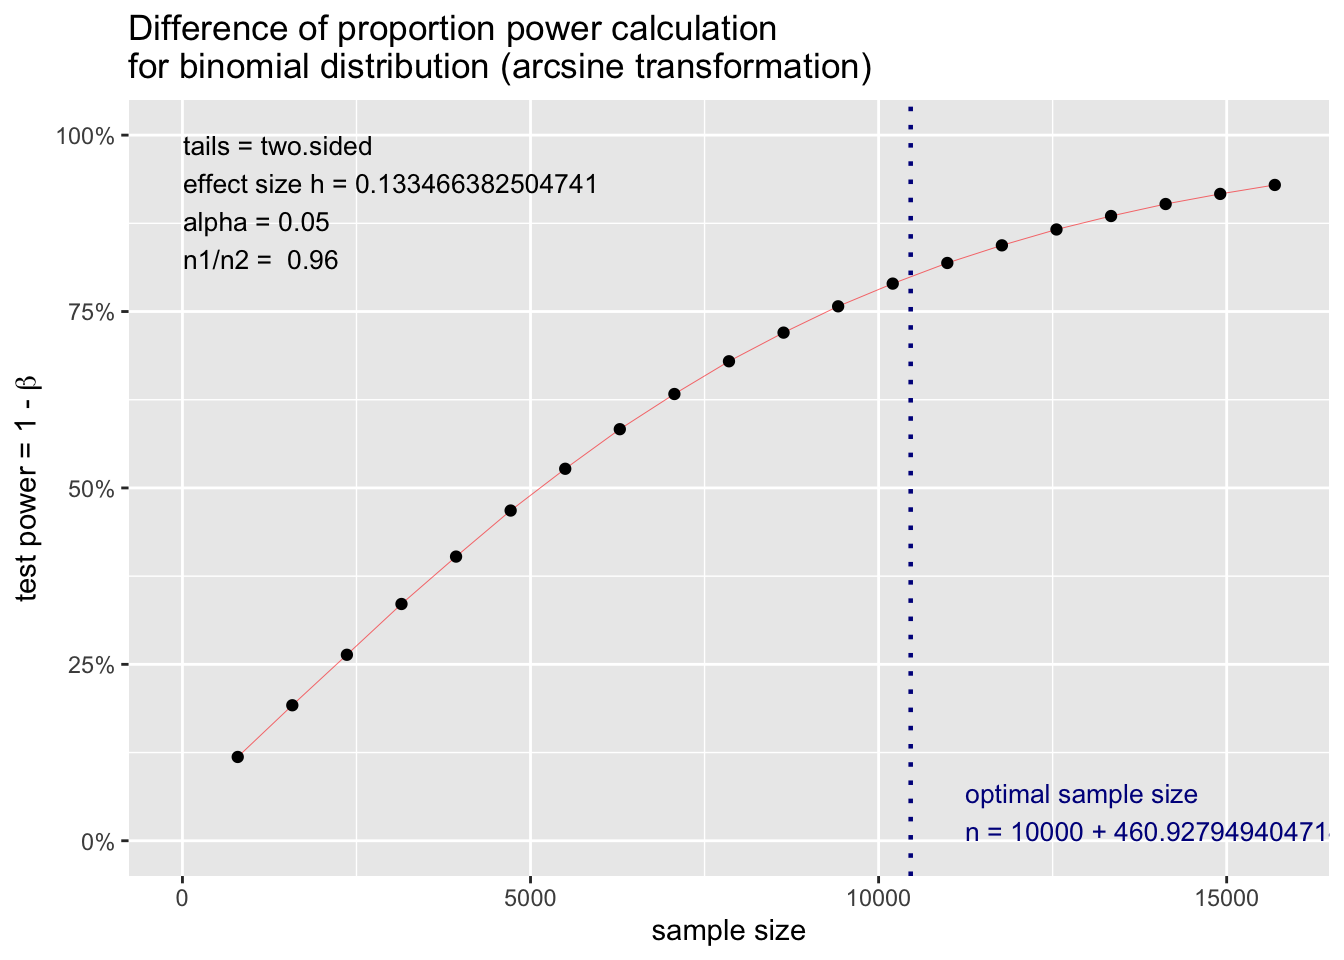
plot(p.out)
As results shown above, we need to have minimum 461 customers in the control group to have a robust result.
Significance Testing
Suppose we ran a campaign with following info:
- Total customers in target group = 10,000
- Total customers in control group = 500
- Response rate in target group = 5%
- Response rate in control group = 2.5%
- Significance level = 0.05 (95% confidence)
- Power = 0.80 (the chance we dont make a false negative error)
Question: The response rate in target group is statistically significant higher than control group?
p.out <- pwr.2p2n.test(h = ES.h(p1 = 0.05, p2 = 0.025)
              , n1=10000
              , n2=500
              , power = 0.8
              , sig.level = NULL)


print(p.out)
##
## difference of proportion power calculation for binomial distribution (arcsine transformation)
##
## h = 0.1334664
## n1 = 10000
## n2 = 500
## sig.level = 0.03837189
## power = 0.8
## alternative = two.sided
##
## NOTE: different sample sizesAs result shown above, since the sig.level = 0.038 which is less than 0.05, so we cannot accept the null hypothesis and this campaign’s response rate in target group is statiscally higher than control group with 95% confidence.
Conclusion
R package pwr provides an easier way to design an experiment and run a hypothesis test. There are also other functions to support different types of statistical test e.g. t-test, chi-squre, anova and correlations etc.
Hope this article helps, happy learning!